LMAO if you don't logstash

This Deck - http://tech.paulcz.net/ACUG-Logstash
Austin Cloud User Group - Log like you mean it!
Paul Czarkowski / paul@paulcz.net
LOG = TIMESTAMP + DATA
Stop inventing date formats
It's a SOLVED problem

ISO 8601
Pro Tips for Logging Success
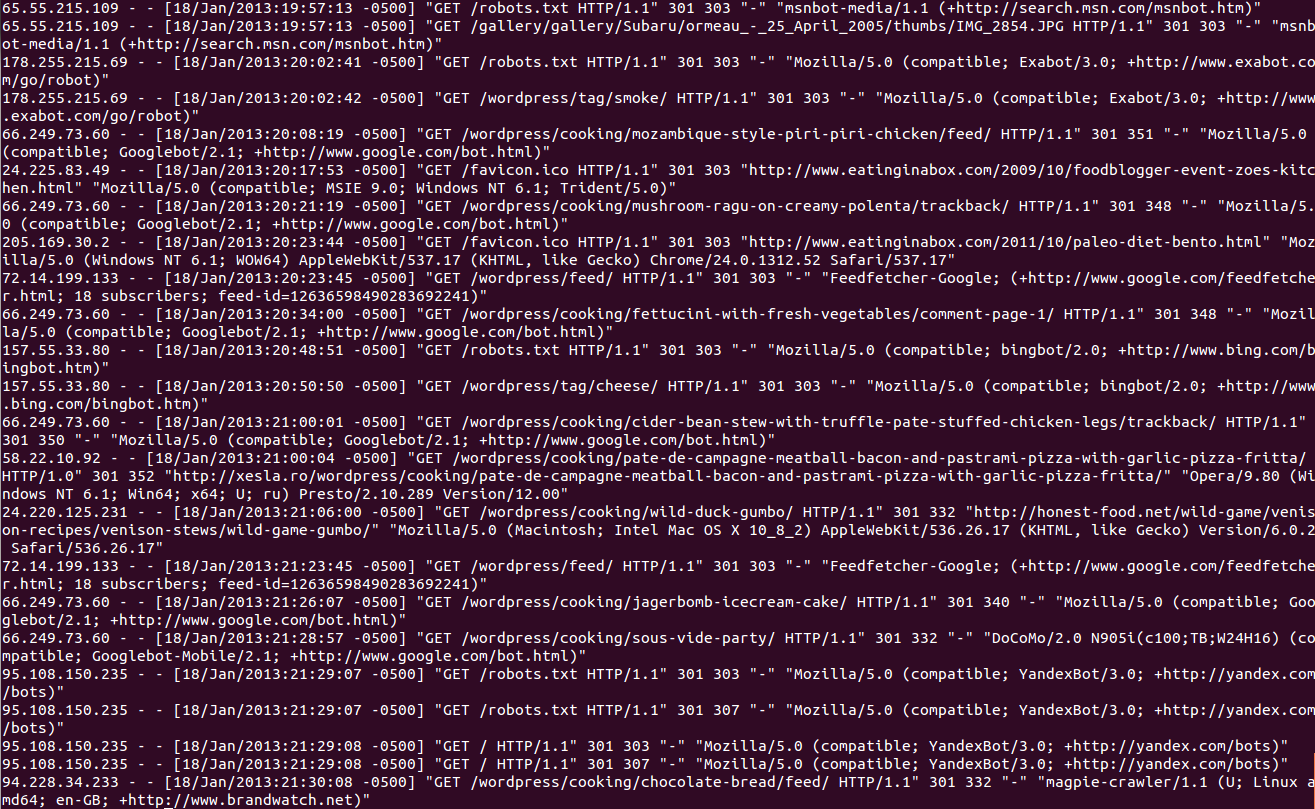
A log is human readable...
208.115.111.74 - - [13/Jan/2013:04:28:55 -0500] "GET /robots.txt HTTP/1.1"
    301 303 "-" "Mozilla/5.0 (compatible; Ezooms/1.0; ezooms.bot@gmail.com)"
"A human readable, machine parsable representation of an event."
...But logs are NOT !
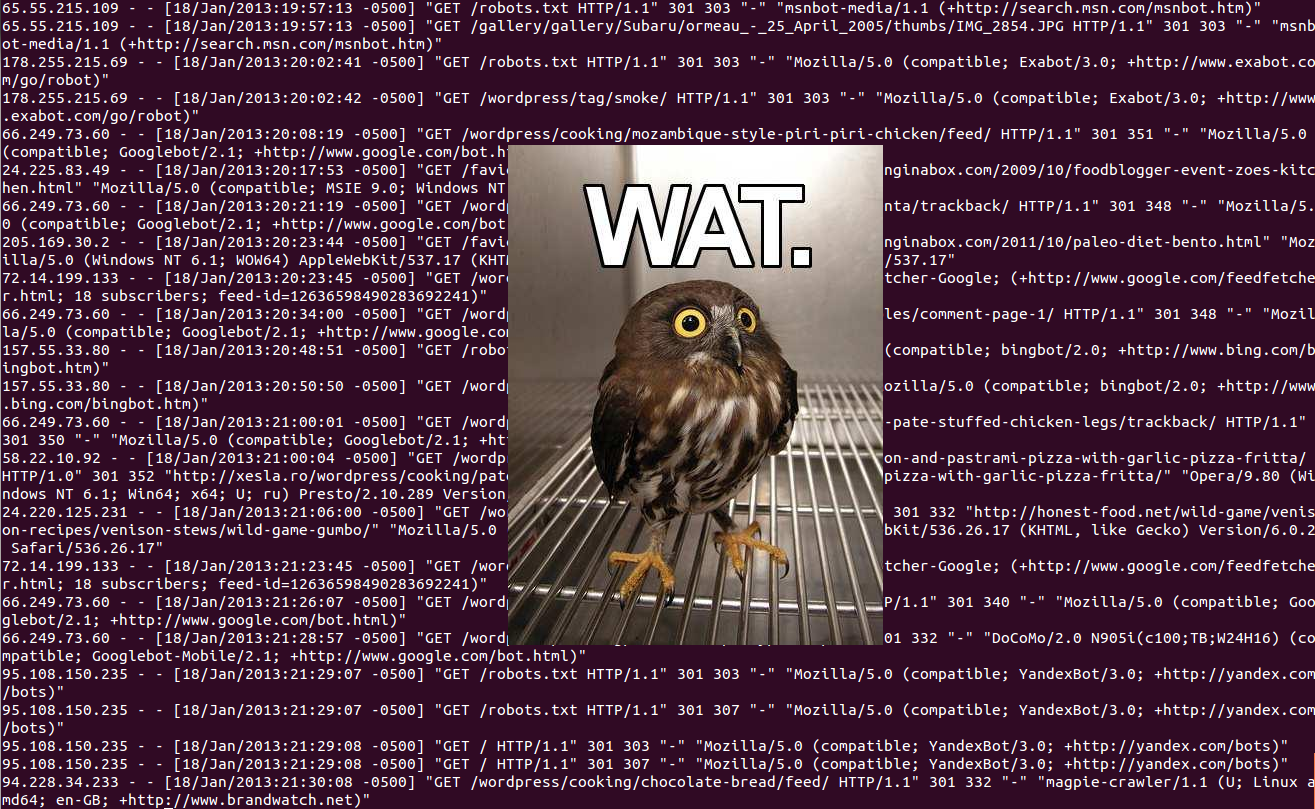
But they're machine parsable ... right?
208.115.111.74 - - [13/Jan/2013:04:28:55 -0500] "GET /robots.txt HTTP/1.1"
    301 303 "-" "Mozilla/5.0 (compatible; Ezooms/1.0; ezooms.bot@gmail.com)"
http://xkcd.com

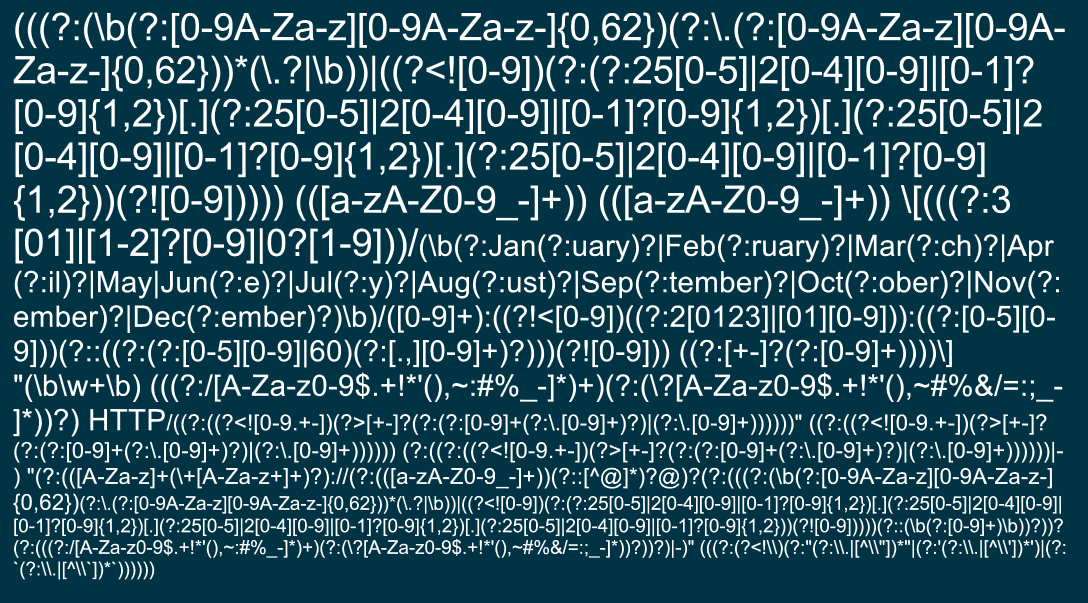
Actual Regex to parse apache logs.
Evolution of log processing
Stage 1 - Single Host
$ grep -I "Invalid user " /var/log/auth.log* | awk '{ print $10; }'
Stage 2 - A handful of hosts
#!/bin/sh
USER=root
KEY=/root/public_key.pub
for HOST in server1 server2 server3 server4
do
  ssh -l $USER -i $KEY $HOST grep -I "Invalid user " \
        /var/log/auth.log* | awk '{ print $10; }'
done
Stage 3 - A lot of hosts
$ grep -r -I "Invalid user " /rsyslog/*/auth.log* | awk '{ print $10; }'
Stage 4 - Start Using Splunk
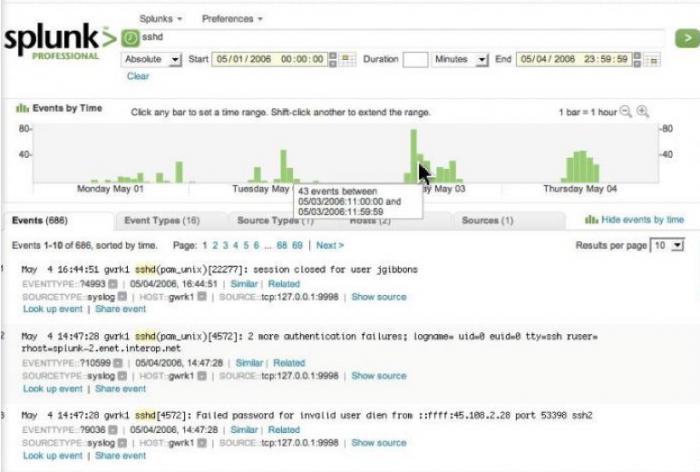
gis://splunk+screenshot
Very Nice!

The first one is free
500MB per day

Stage 5 - Get your first
invoice from Splunk

$,$$$,$$$
Stage 6 - Opensource!
"If a new user has a bad time, it's a bug."
Remember this ?
208.115.111.74 - - [13/Jan/2013:04:28:55 -0500] "GET /robots.txt HTTP/1.1"
    301 303 "-" "Mozilla/5.0 (compatible; Ezooms/1.0; ezooms.bot@gmail.com)"
Logstash uses a series of Plugins ...
plugins$ cat chained | grep together | sed 's/like/unix/' > pipeline
logstash.conf
input {
          ### 34 inputs!
}
filter {
          ### 29 filters!
}
output {
          ### 47 outputs!
}
A couple of key filters -
grok
helps parse arbitrary text and structures it.
labels instead of regex patterns.
USERNAME [a-zA-Z0-9_-]+
USER %{USERNAME}
INT (?:[+-]?(?:[0-9]+))
MONTH \b(?:Jan(?:uary)?|Feb(?:ruary)?|Mar(?:ch)?|Apr(?:il)?|May|Jun(?:e)?|Jul(?:y)...
DAY (?:Mon(?:day)?|Tue(?:sday)?|Wed(?:nesday)?|Thu(?:rsday)?|Fri...
COMBINEDAPACHELOG %{IPORHOST:clientip} %{USER:ident} %{USER:auth}
  \[%{HTTPDATE:timestamp}\] "(?:%{WORD:verb} %{NOTSPACE:request}
  (?: HTTP/%{NUMBER:httpversion})?|-)" %{NUMBER:response}
  (?:%{NUMBER:bytes}|-) %{QS:referrer} %{QS:agent}
Turns complex regular expressions into
simple and repeatable patterns.
pattern => ["%{USER} %{MONTH}"]
grok
filter {
          grok {
                type       => "apache"
                pattern  => ["%{COMBINEDAPACHELOG}"]
        }
}
turns this:
208.115.111.74 - - [13/Jan/2013:04:28:55 -0500] "GET /robots.txt HTTP/1.1"
    301 303 "-" "Mozilla/5.0 (compatible; Ezooms/1.0; ezooms.bot@gmail.com)"
into this:
{
        "client address": "208.115.111.74",
        "user": null,
        "timestamp": "13/Jan/2013:04:28:55 -0500",
        "verb": "GET",
        "path": "/robots.txt",
        "query": null,
        "http version": 1.1,
        "response code": 301,
        "bytes": 303,
        "referrer": null
        "user agent": "Mozilla/5.0 (compatible; Ezooms/1.0; ezooms.bot@gmail.com)"
}
Date
takes a timestamp and makes it ISO 8601 Compliant
Turns this:
13/Jan/2013:04:28:55 -0500Into this:
2013-01-13T04:28:55-0500and uses it as the timestamp of the event.
Date
filter {
          date {
                type   => "apache"
                match  => ["timestamp","dd/MMM/YYY:HH:mm:ss Z"]
        }
}
Remember our Apache log from earlier?
Define Inputs and Filters.
input {
        file {
            type => "apache"
            path => ["/var/log/httpd/httpd.log"]
        }
}
filter {
        grok {
            type    => "apache"
            pattern => "%{COMBINEDAPACHELOG}"
        }
        date {
            type => "apache"
        }
        geoip {
            type => "apache"
        }
}
Define some Outputs.
output {
        statsd {
            type      => "apache"
            increment => "apache.response.%{response}"
            # Count one hit every event by response
        }
        elasticsearch {
            type => "apache"
        }
}
Graphite !
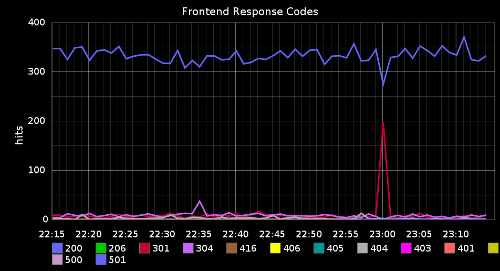
image 'borrowed' from @jordansissel
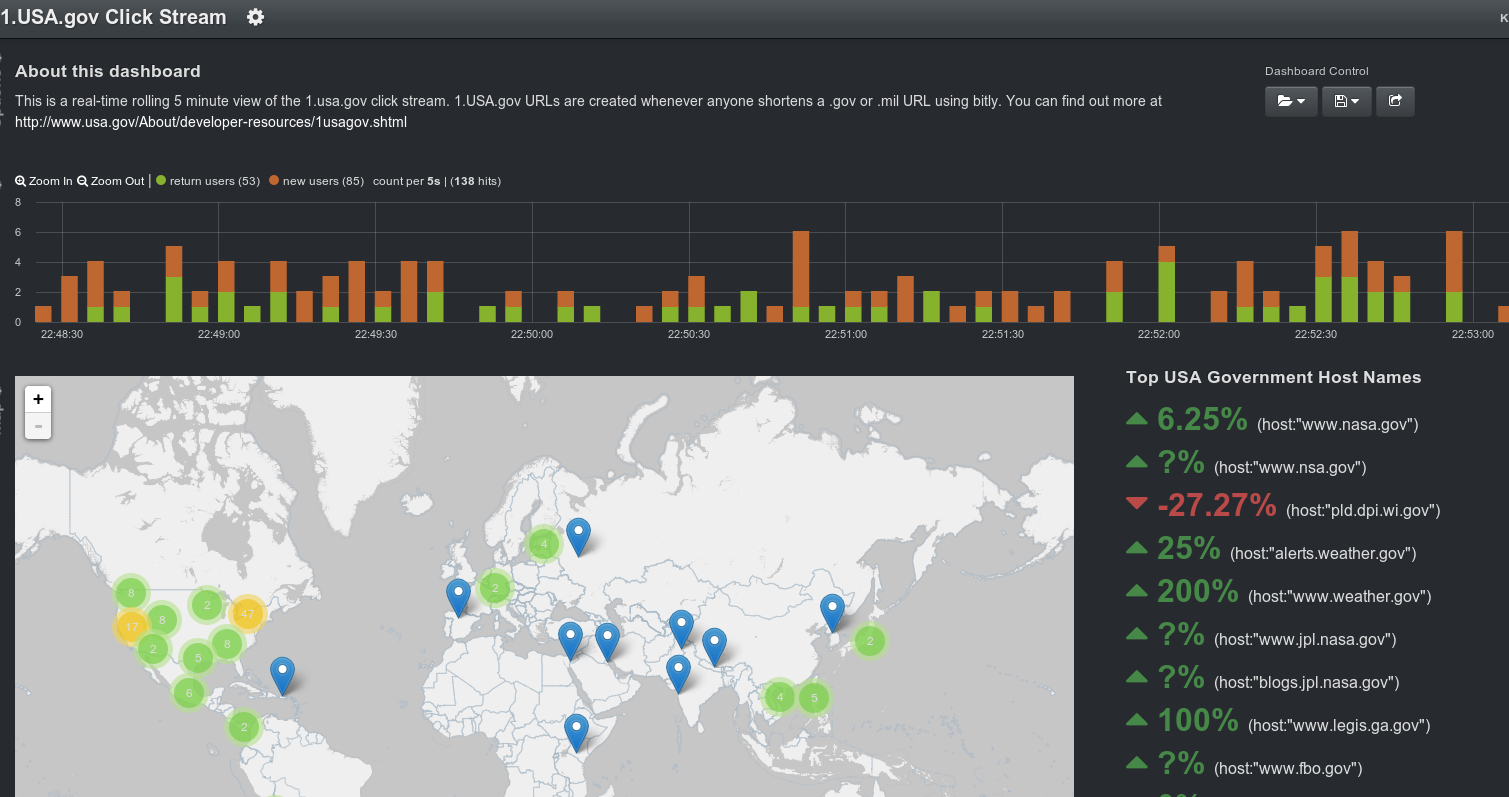
Kibana - Logstash Web Frontend

Kibana - Custom Dashboards!
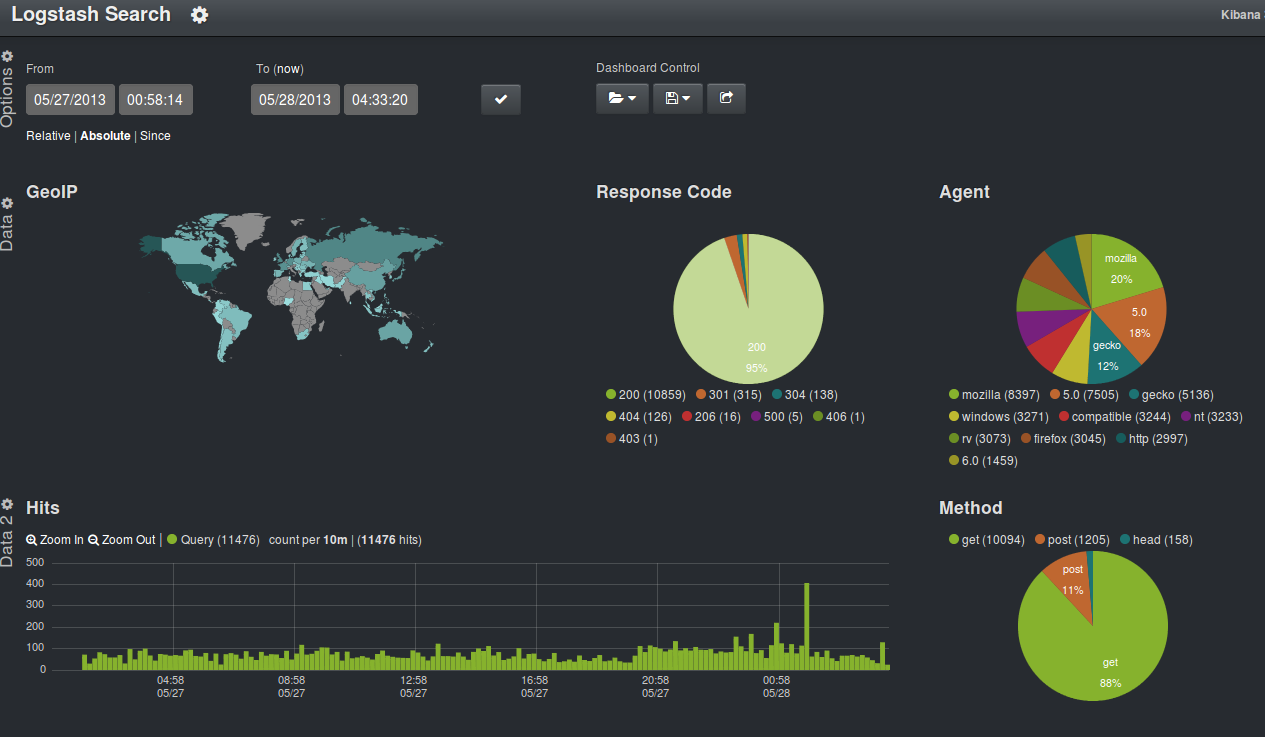
Visualize Important Data!
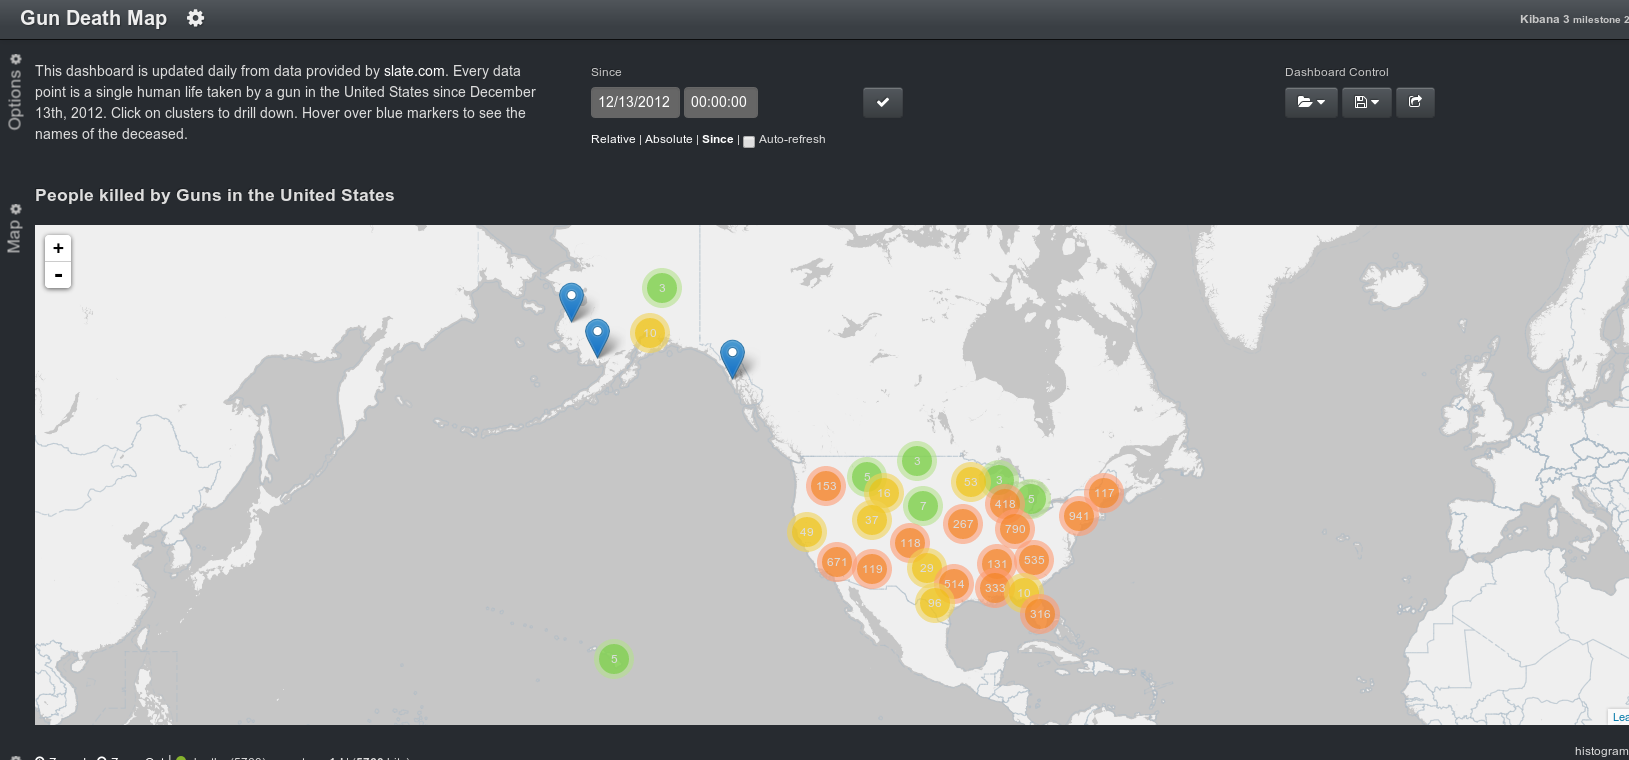
Interesting Analytics

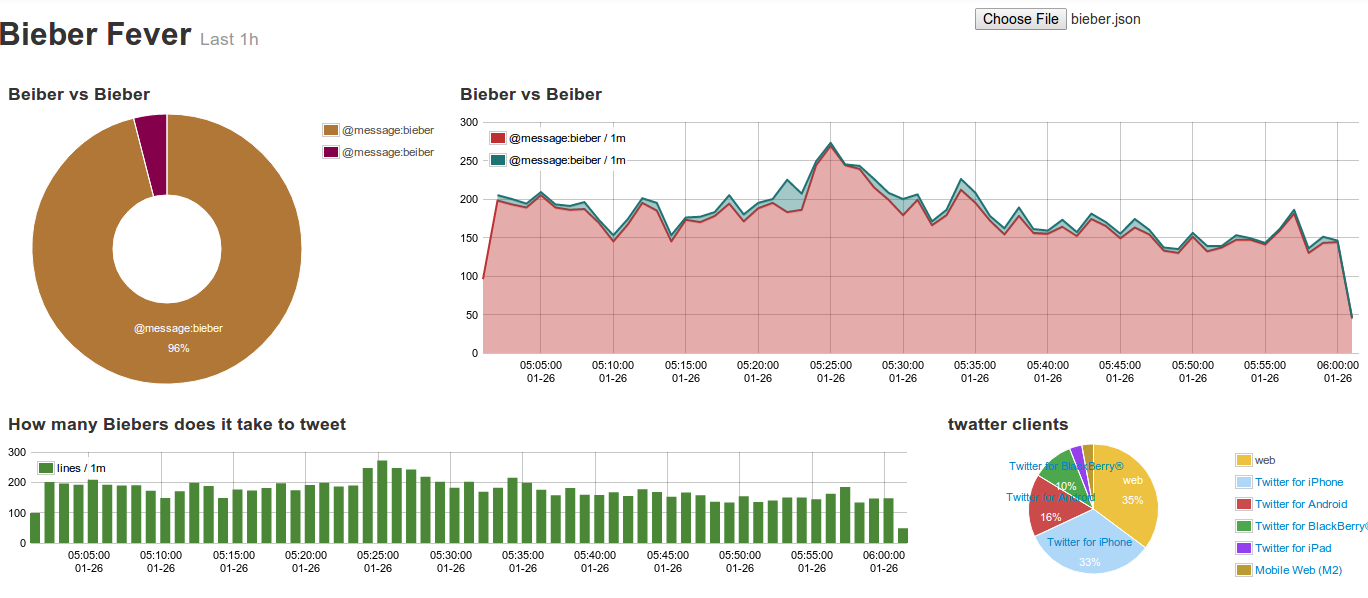
Analyze Twitter Streams
Logstash - Twitter Input
input {
    twitter {
        type      => "twitter"
        keywords  => ["bieber","beiber"]
        user      => "username"
        password  => "*******"
    }
}
output {
    elasticsearch {
        type => "twitter"
    }
}

Already have Central Rsyslog/SyslogNG Server?
input {
    file {
        type => "syslog"
        path => ["/data/rsyslog/**/*.log"]
    }
}
filter {
    grok {
        type => "syslog"
        pattern => "%{SYSLOGBASE}"
    }
    date {
        type => "syslog"
        match => ["timestamp", "MMM dd HH:mm:ss"]
    }
}

output {
    type => "elasticsearch"
}
Act as a Central Syslog Server
Good for Appliances / Switches
input {
    udp {
        type => "syslog"
        port => "514"
    }
}
filter {
   grok {
        type => "syslog"
        pattern => "%{SYSLOGBASE}"
    }
    date {
        type => "syslog"
        match => ["timestamp", "MMM dd HH:mm:ss"]
    }
}
output {
    type => "elasticsearch"
}
Use matching inputs and outputs to
Send file contents to another logstash for processing
Use an encrypted Transport
input  {
    file {
        type => "openstack"
        path => ["/var/log/cinder/*.log", "/var/log/nova/*.log"]
    }
}
output {
    lumberjack {
        hosts           => ["logstash-indexer1", "logstash-indexer2"]
        ssl_certificate => "/etc/ssl/logstash.crt"
    }
}
input {
    lumberjack {
        type            => "openstack"
        ssl_certificate => "/etc/ssl/logstash.crt"
        ssl_key         => "/etc/ssl/logstash.key"
    }
}
filter {
    grok {
        type    => "openstack"
        pattern => "%{OPENSTACK}"
    }
}
output {
    elasticsearch {}
}
System Metrics ?
input {
    exec {
        type => "system-loadavg"
        command => "cat /proc/loadavg | awk '{print $1,$2,$3}'"
        interval => 30
    }
}
filter {
    grok {
        type => "system-loadavg"
        pattern => "%{NUMBER:load_avg_1m} %{NUMBER:load_avg_5m} %{NUMBER:load_avg_15m}"
        named_captures_only => true
    }
}
output {
    graphite {
        host => "graphite-server"
        type => "system-loadavg"
        metrics => [ "hosts.%{@source_host}.load_avg.1m", "%{load_avg_1m}",
                     "hosts.%{@source_host}.load_avg.5m", "%{load_avg_5m}",
                     "hosts.%{@source_host}.load_avg.15m", "%{load_avg_15m}" ]
    }
}
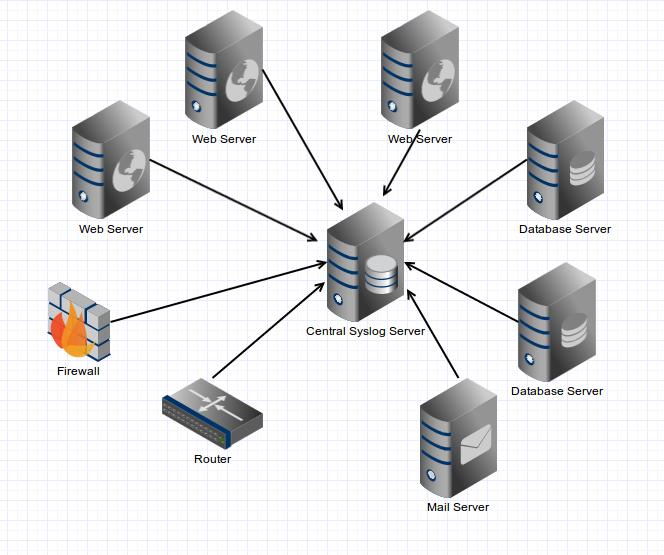
Logstash Architecture
Use Queues ( RabbitMQ, 0mq, Redis) to help scale horizontally.
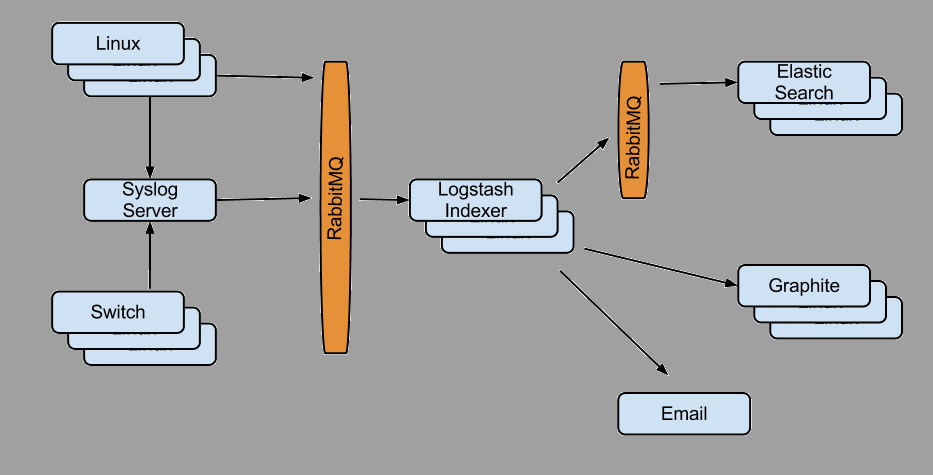
Local log dir on clients = cheap queue
Further Reading
Questions ? Live Demo ?

https://github.com/paulczar/docker-logstash-demo
paul@paulcz.net | @pczarkowski | tech.paulcz.net